2023-02-23
The performance of your app matters. From ensuring a good user experience to retaining users, performance makes a difference in your app’s success. Using the right tools can make it easier to ensure your code is meeting your performance goals, before you have to switch to a bigger EC2 instance or users start complaining.
One of the best tools in a developer’s toolbox for ensuring good performance is profiling. It’s extremely difficult to predict precisely where your code will be slow in production, which is one of the many reasons people recommend against premature optimization. However, profiling tools can show you the exact lines in your code that are slow and enable you to make and test specific optimizations.
This 3 part series will explain what profiling is, why you should be profiling your code in production, and explore some popular tools for profiling.
While profiling may be a new term for many developers, profiling tools have been around for decades. Profiling is a way to capture a snapshot of a program’s resource usage, called a profile, and connect that snapshot to the codebase in a way that allows you to directly map resource usage to lines of code. Profiling is a type of dynamic analysis, meaning it measures the code as it runs. This means profiling allows you to get an accurate picture of how your code is behaving both locally and in production, including interactions with databases and other services.
Before we dig into the details of profiling, let’s take a moment to discuss the difference between profiling and tracing.
Tracing is another tool commonly used for monitoring performance. Tracing tracks the flow and timing of requests as they pass through a system, which helps you understand the performance of that system and identify bottlenecks. A trace is a log of events that occurred during a program’s execution. Distributed tracing creates these traces through a distributed system, e.g. tracking across your backend and your frontend.
By tracing a request from the frontend to the backend, and back again, you can get insight into which services are involved and how long they take. Often, external services and databases are the biggest cause of latency in your app, and tracing is great at identifying and measuring these slowdowns.
However, if your app is slow due to internal issues rather than external calls, tracing may not be as good at showing you exactly where the problem is. The information you can get from a trace is only as granular as the spans you’ve manually instrumented in your code. A CPU profiler, on the other hand, can give you function and line level detail about where your code is slow, without needing to instrument every function.
Profiling is a very broad term and profilers can be implemented in a variety of ways. For example, the data a profiler collects can include usage of CPU, GPU, memory, I/O, networking and more. Most profilers only include one or two types of this data. Most modern profiling tools are CPU profilers that measure the performance of code running on a CPU, and the rest of this series will focus on CPU profilers.
In addition, most of the examples we’ll use in this post are about frontend and backend development, but profiling is useful to understand the performance of any type of code. In fact, profilers have been in use since the 1970’s to improve the performance of operating systems and compilers.
Profiling can either be done continuously (i.e. all the time), ad hoc (e.g. collecting a profile of your site manually using a tool like Chrome DevTools), or somewhere in the middle.
Ad hoc profiling
Ad hoc profiling is the easiest way to get a profile for your web app, but most ad hoc profiling tools have limited capabilities. One very popular ad hoc profiling tool is the Chrome DevTools performance panel. It allows you to record a basic CPU profile for any website by pressing a button. While this and other ad hoc profiling tools are convenient for getting a quick look at a website’s performance, the data collected in the profile isn’t very complete.
Chrome DevTools profiles are primarily useful for getting a quick understanding of the performance of a website’s frontend — but can’t accurately capture data for the backend. In addition, the profile is specific to your machine and may not accurately reflect the experience other users are having. Finally, there’s no easy way to automate collecting these profiles in DevTools, so you would need to manually create a profile every time you want to look at performance data and hope that profile accurately represents user experience.
Continuous profiling
At the other extreme, continuous profiling is the gold standard for comprehensive profile data. A continuous profile is a long running profile that is automatically collected over the entire runtime of an application or an entire user session. In contrast to ad hoc profiling, continuous profiling runs automatically during every user session. This enables you to get a clear picture of actual user experience at any time of day, using computed metrics like wall time (the amount of real-world time a call takes to complete).
Of course, continuous profiling also comes with downsides. Continuous profiles can be arbitrarily long, which can make them hard to work with and find information in, and require processing large amounts of data.
Transaction-based profiling
In between ad hoc profiling and continuous profiling, there is a wide spectrum of possible other profiling configurations— including transaction-based profiling. Transaction-based profiling is a profiling method that automatically collects a profile while a transaction is happening in your app.
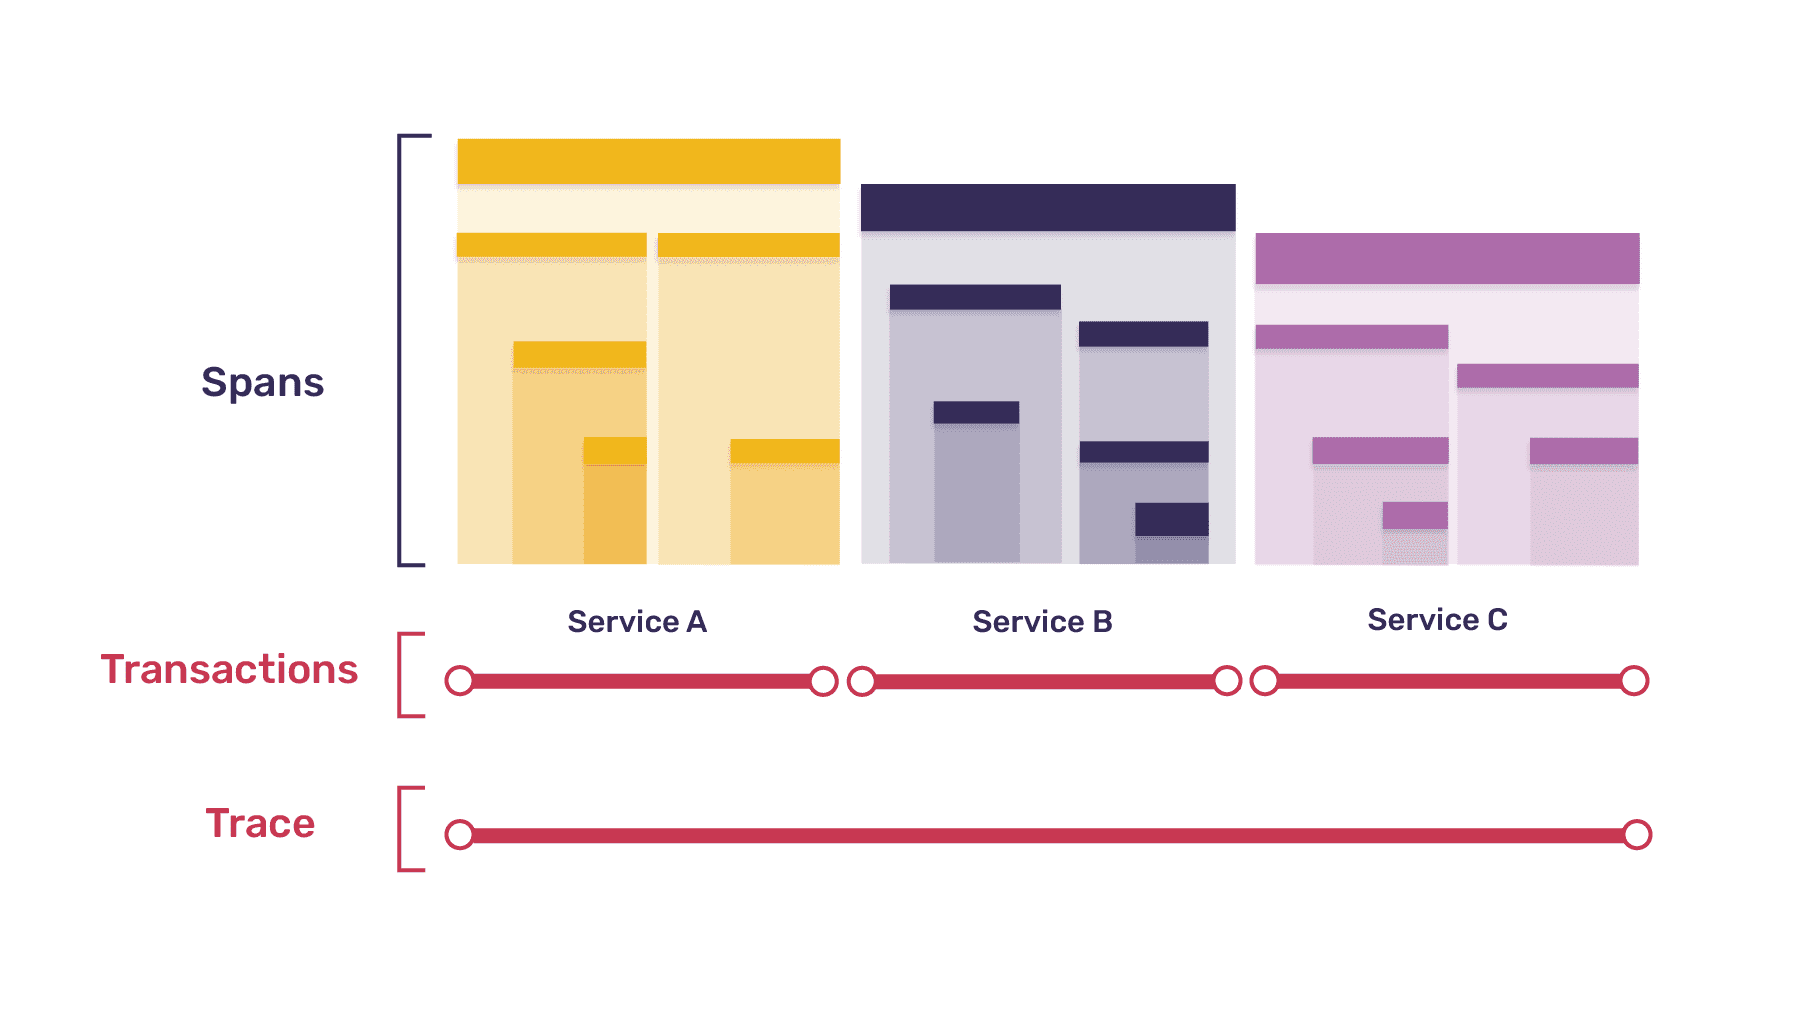
Transactions are a concept from tracing. A transaction is a single instance of a service being called in your app inside of an important operation — like a page load, navigation, or async task. A collection of transactions make up a trace.
Transaction-based profiling offers the benefits of automatic profiling, capturing what’s actually happening on your users’ machines as it happens, but doesn’t collect as much data as continuous profiling. In transaction-based profiling, profiles are automatically collected only while a transaction is happening.
This makes it possible to either collect profiles 1:1 with transactions (e.g. each transaction captured also captures a profile) or to undersample profile collection relative to transactions, which means that while each profile is associated with a transaction, not every transaction has a profile. Since collecting a profile is more computationally-intensive than capturing a transaction, undersampling can help ensure your profiling tool itself isn’t making your app’s performance worse.
Additionally, linking profiles to transactions provides a straightforward mental model for exploring and understanding performance data from transactions and profiles.
Here’s a summary table showing the differences between ad hoc profiling, continuous profiling, and transaction-based profiling.
| Ad hoc profiling | Continuous profiling | Transaction-based profiling | |
|---|---|---|---|
| How is a profile created? | Manually | Automatically | Automatically |
| When is a profile generated? | On demand | Always | While a transaction is happening |
| Requires instrumenting your code? | No code changes required | Yes | Sometimes, if automatic instrumentation isn’t available |
| Environment best suited for | Development | Production | Production |
There are many ways to implement a profiling tool. CPU Profilers typically fall into two categories— deterministic and sampling — depending on how the profiles are collected.
Deterministic profilers
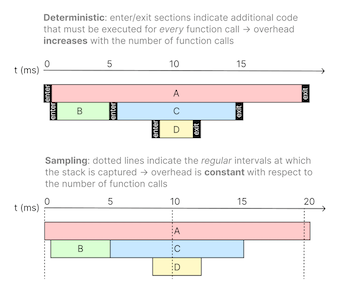
Deterministic profiles are also known as tracing profilers. They prioritize accuracy over performance. They capture all function call, function return, and exception events, and also record precise timings for the intervals between these events.
Sampling profilers
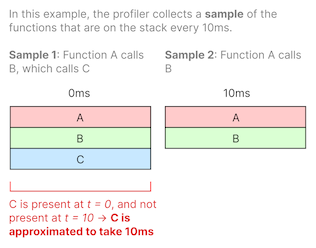
Sampling profilers, or statistical profilers, prioritize not adding performance overhead. They grab the call stack at regular intervals, collecting samples from each thread and computing function durations using statistical techniques.
For example, if a call stack capture shows function A calling function B calling function C (A → B → C) and the next capture 10ms later shows A → B without C, we can interpolate the function duration of C to be about 10ms since it existed on the stack at the first sample and no longer exists as of the second sample.
All profilers can use a deterministic or sampling approach to collecting profiles regardless of how they are run, but the distinction matters a lot more for continuous and transaction-based profiling tools that run automatically in production, since any performance overhead they add directly impacts users.
While deterministic profilers give a fuller picture of what’s going on, measuring every function call in production has a high overhead. In contrast, statistical profilers have a fixed overhead with regard to the number of function calls. Using a statistical profiler instead of a deterministic profiler ensures the profiler will have a lower and more consistent performance overhead in production. Because of this, most profilers used in production are sampling profilers.
Based on what you’ve read about deterministic vs. sampling profilers, you’re probably wondering how much overhead profiling actually adds to your code in production.
In general, the more data the profiler collects and the more often it collects it, the greater performance impact the profiler will have. As mentioned, sampling profilers almost always have a lower overhead than deterministic profilers.
Sentry makes transaction-based sampling profilers for Android, iOS, Node and Python. While overhead varies by platform, hardware, and the application being profiled, all of Sentry’s profiling products target a <10% CPU time overhead.
And of course, for ad hoc profilers, collecting a profile of your code only affects performance while that ad hoc profile is being collected.
Getting started with profiling can be intimidating, especially because the term “profiler” is used to refer to so many specific types of tools.
Want to learn more? Check out Profiling 101 pt. 2: Why profiling?.